
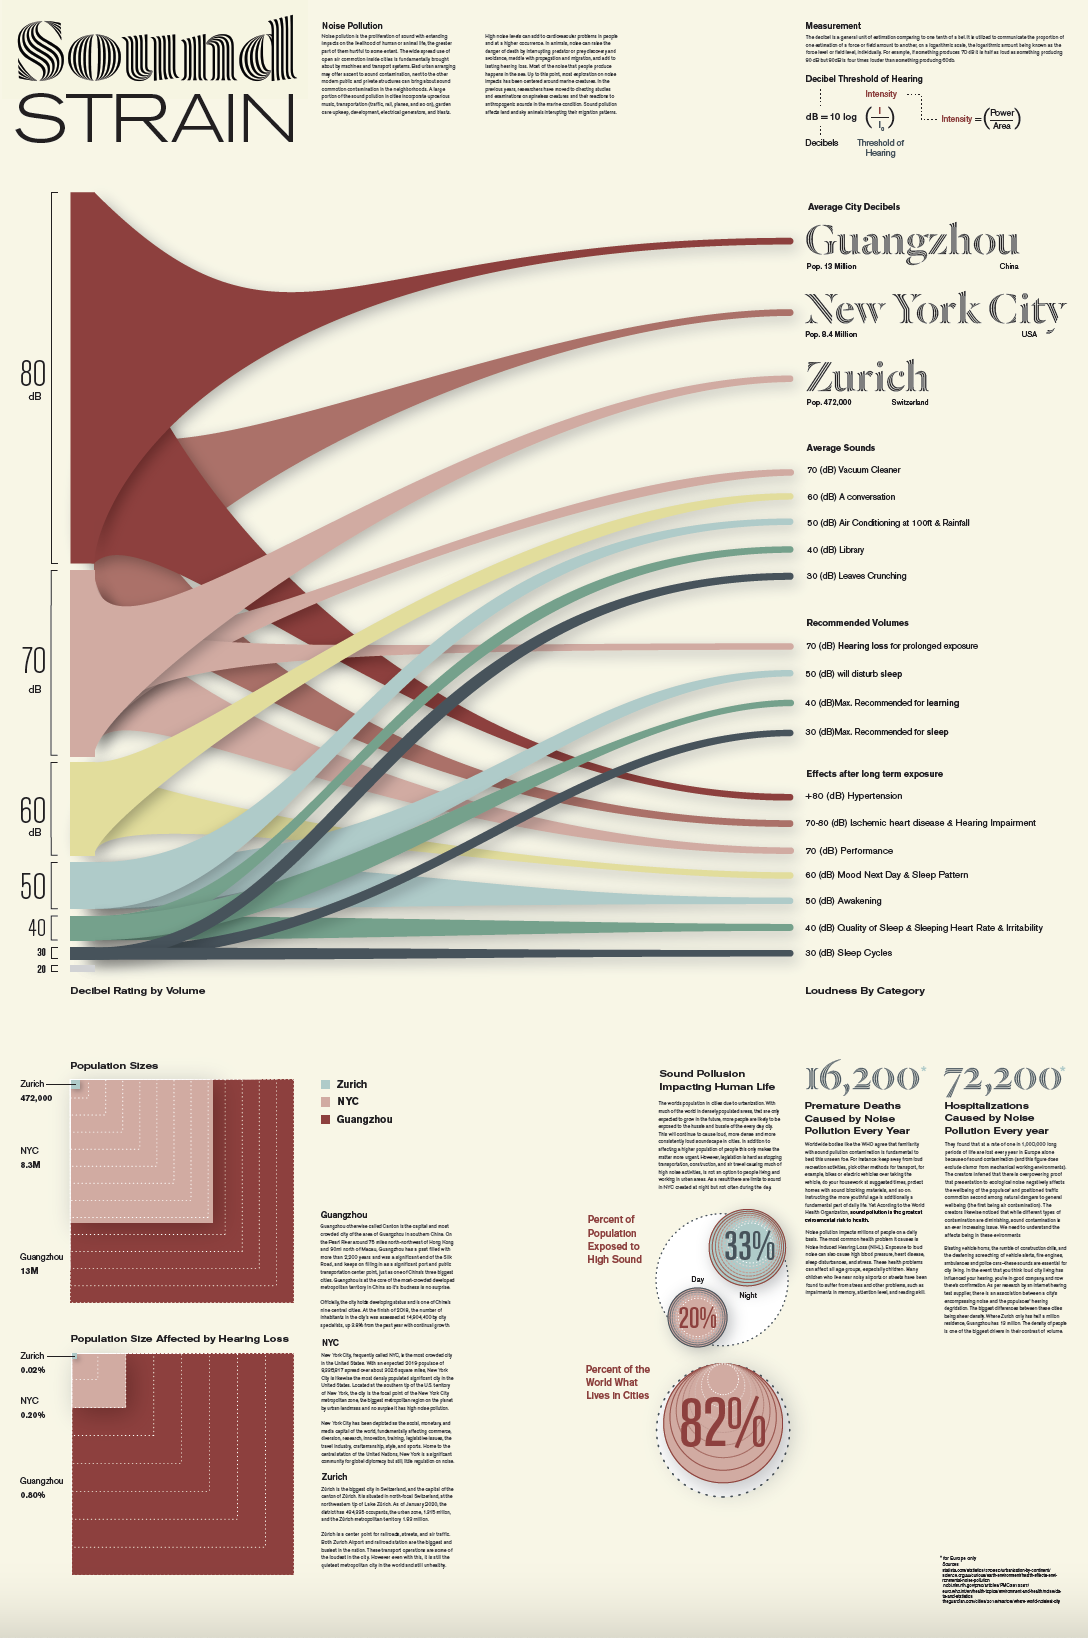
A comparison on the sound level of 3 cities: Guangzhou, China; Zurich, Switzerland; and New York City, New York. Infographic is intended to show how different cities compare as well as visually conveying how sound is measured. To highlight the issue of sound pollution, the decibel scale is used along with how loud different cities noises register.
Click image(s) to enlarge
Concept
Sound Strain was created to help the veiwer understand noise pollution. This posters main graph is comparing decible ratings of the loudest city in the world, Guangzhou, to the quietest, Zurich. The graph also include sounds we may be familiar with and how loud they are and how loud noises effect humans well-being. To explain why the loudest city is different from the quetest, the bottom left graphs compare population sizes and populations effected by hearing loss.
The bottom right information expresses why constant exposure to sound is unhealthy for humans. The Echoed exhibit follows noise pollution in the environment rather than in cities which can be found here.